Solve your data quality problems, and get a spend cube within days.
How it works
- We schedule a 30 minute "kickoff call" where we walk you through the CSV export process for each of your major tools.
- You'll wait 5 business days, while Airflip assembles your spend cube.
- We schedule a 30 minute call to review your spend cube dashboard. We'll let you know what assumptions we made and the top transactions where human review would be beneficial.
The deliverable
Our powerful Spend Analytics solution puts the most important insights at your fingertips, while giving you the control to answer any question that comes up.
- Intuitive Dashboard
Visualize any aspect of your spend data through a variety of charts (like managed spend over time, and Pareto charts). Easily export charts to share reports with your key stakeholders.
- Excel-like Experience
Harness the power of spreadsheets right in your browser. Manipulate your data with ease using filters, sorts, row groups, pivots, and save your custom views.
- Consolidation Opportunities
Discover potential redundancies and duplicative spend. Identify areas where you should staff procurement resources to increase savings.
How we do things
Our process
- Step 1: Data Consolidation:
- We gather all your spend data—such as invoices, contracts, credit card transactions, and POs—into one place. Then, we connect and match the information to provide a unified view of your total spend.
- Step 2: Supplier Name Normalization:
- Our system identifies and standardizes variations in supplier names, ensuring consistency across transactions. For example, "Verizonb," "Verizion," and "Verizon IT" will all be normalized to "Verizon." We also link related subsidiaries, like TracFone Wireless and Verizon Fios, under their parent company.
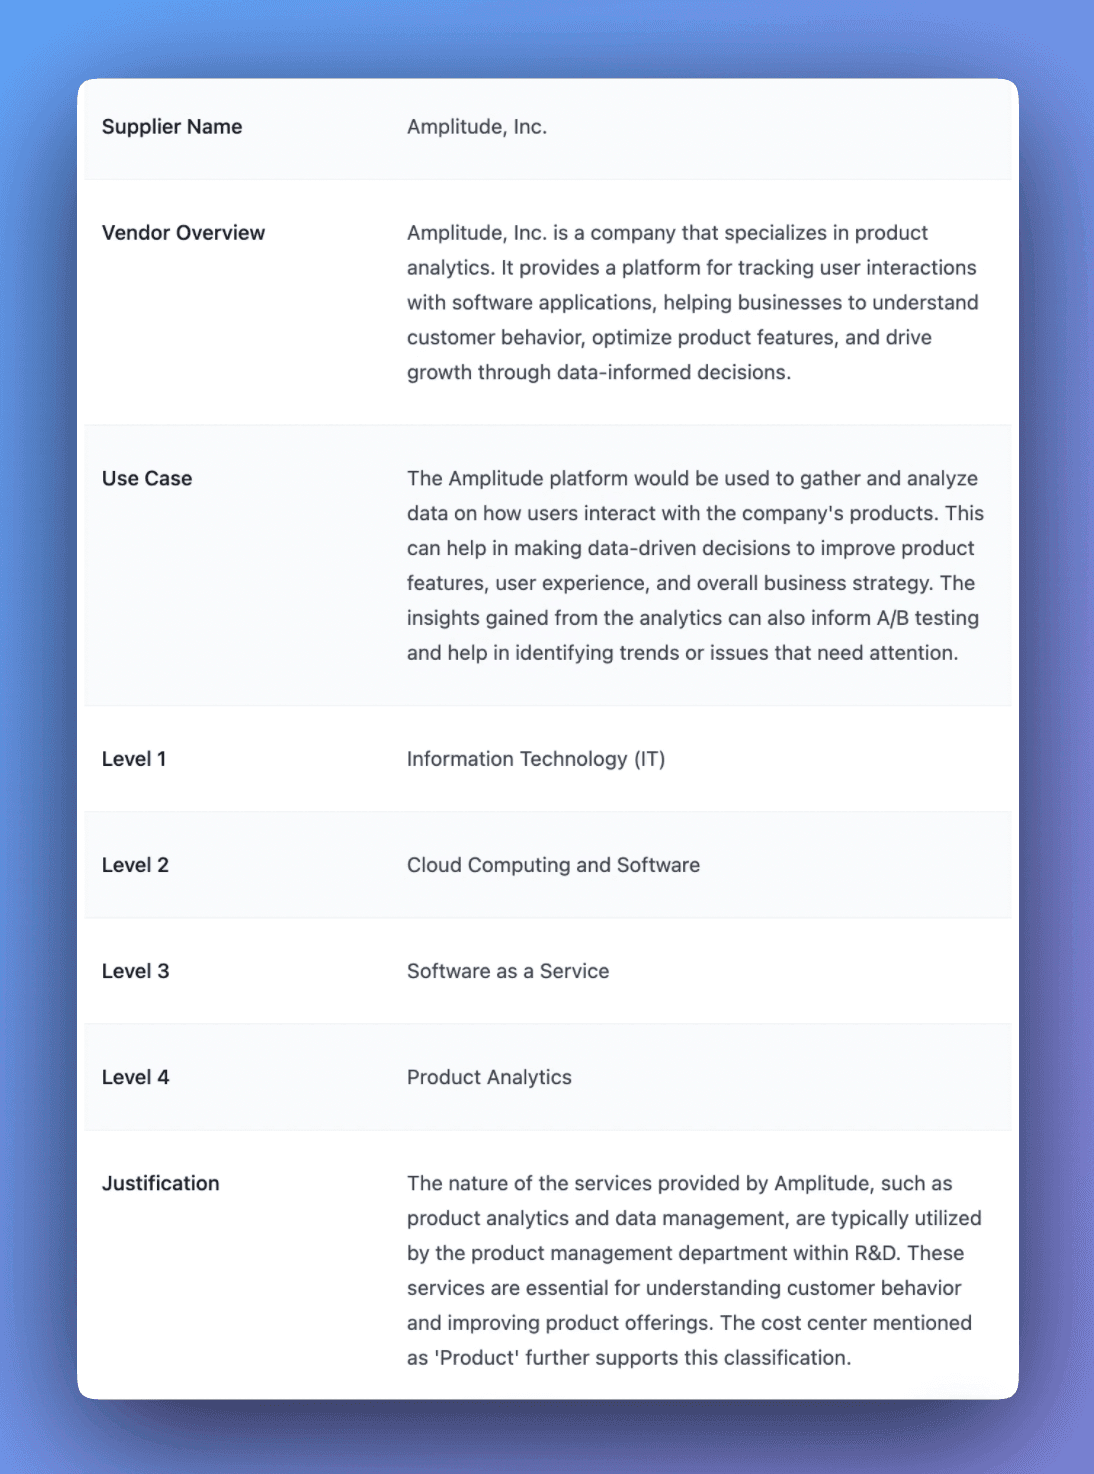
- Step 3: Custom Categorization:
- We build a tailored taxonomy for your data, with three levels of detail (e.g., Professional Services > Financial Services > Audit). This procurement-specific taxonomy provides a more granular view than standard general ledger (GL) classifications.
- Step 4: Cost Center Optimization:
- We clean up your cost center mappings and can suggest improvements. For example, if cloud hosting is categorized as a Direct Cost, we might recommend reassigning it to R&D or IT Infrastructure.
- Step 5: Seamless Review and Customization:
- Already have your own taxonomy? Send it to us, and we'll integrate it seamlessly. Our rule engine also lets you add custom rules, like tagging transactions from specific resellers based on their unique categories.
Dynamic Spreadsheets
- Customizable Views:
- Manage spend data with flexible views.
- Data Organization & Aggregation:
- Sort, filter, and group data by any field.
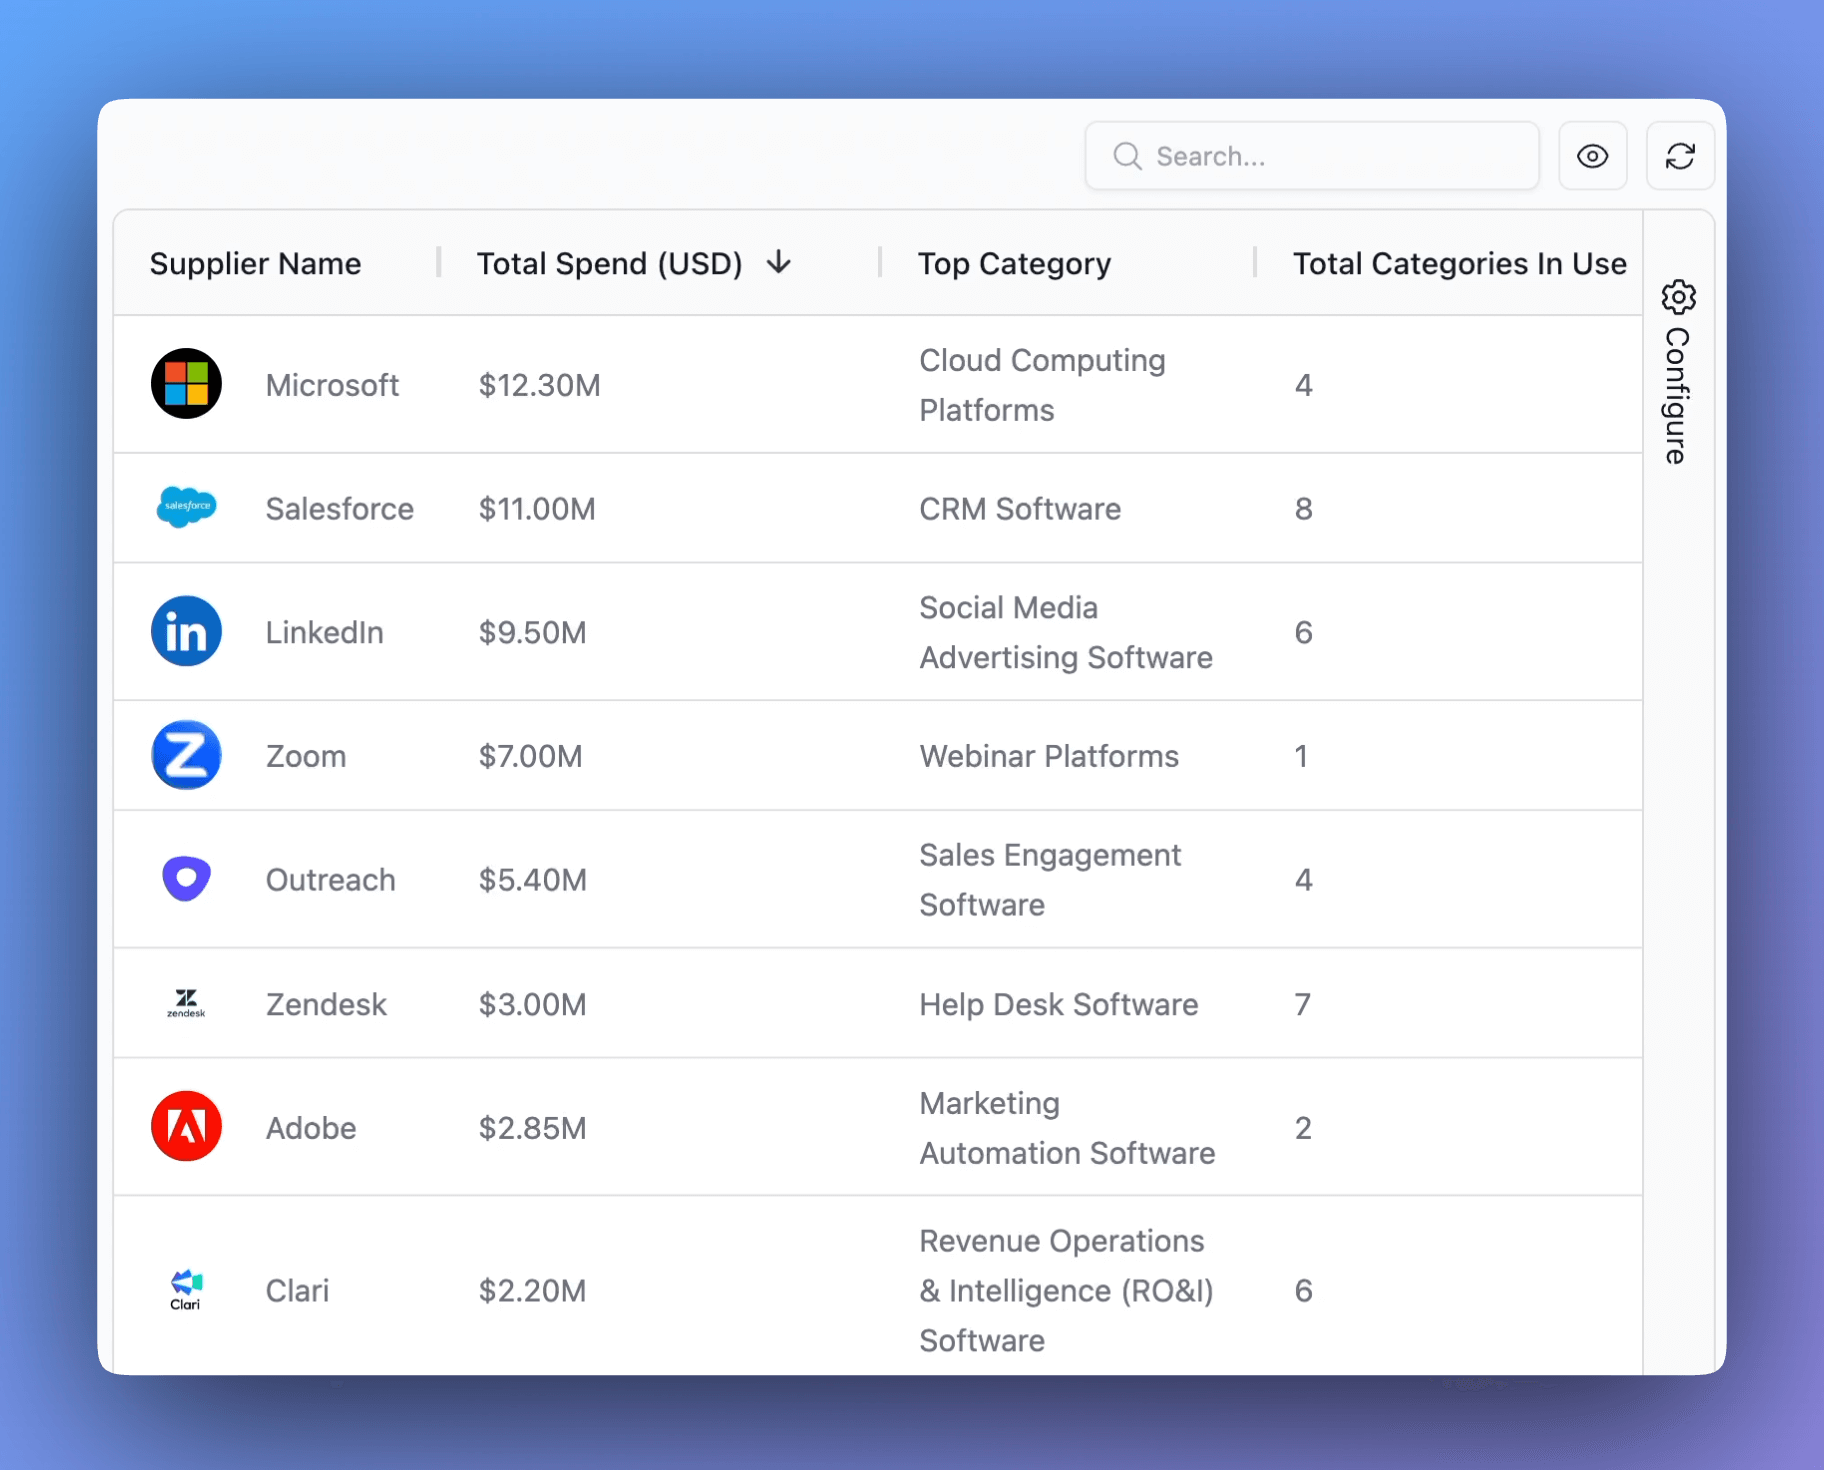
- Supplier Drill-Downs:
- See the total spend for categories and suppliers. Drill down into detailed supplier profiles for deeper insights.
Spend Dashboard
- Visualize your spend:
- Investigate spend data through interactive charts organized by Supplier, Category, and Cost Center.
- Dynamic filters:
- Answer specific questions by filtering for specific dates, spend amounts, or categories.
- Isolate problematic transactions:
- Drill down into chart elements to see the relevant transactions.
Sign up for a Proof of Concept today.
With our one-month Proof of Concept, you can witness the power of a comprehensive spend cube across all your data - all in less than 2 hours of work.